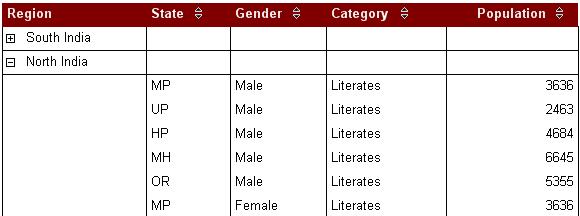
Adding drill downs
The drill down functionality in SSRS allows you to have areas of your report that
can expand and collapse, much like a tree view.
Create a new report with simple table.
Navigate to the
Layout tab and drag a new table control onto the
page.
The first thing we need to do is to
add a group to the table.
Click the table to highlight it, then right-click on the little box with three horizontal
lines in it that appear at the left side of the table at the beginning of
detail
row.
Select
Insert Group. When the Group Dialog appears use
=Fields!Region.Value
as the expression, so that the report now groups on Region. Now drag the Region
field into the first column on the
Group row. Next, drag the State,
Gender, Category and Population fields into the
detail row. Add
some formatting, and preview the report.

We've now performed a grouping, but we still have to enable the drilldown.
Click on the table to highlight it. Right-click on the nub that appears, just to
the left of the detail row. Select
Properties. When the Properties
window opens, expand the
visibility section. Set the
Hidden
property to
True and set the
Toggle Item property
to
State. The Hidden property determines the state of the row when
the report is first run. If we set it to True then the data is collapsed and hidden.
By setting the
Toggle Item property to State, when the report is
run a little + sign appears next to it when the report is run and it works like
a tree view.

Switch to the
Preview tab and run the report. Now only the States
appear, but you can see the customer in each State by using the tree-style +/- controls.